

Interactive Executive Dashboard
Oil & Gas Company
Year
2025
Client
Major Oil & Gas Company
Industry
Oil & Gas
Type
Interactive Executive Dashboard
Role
Lead Product Designer
Project Length
12+ Months
Challenge
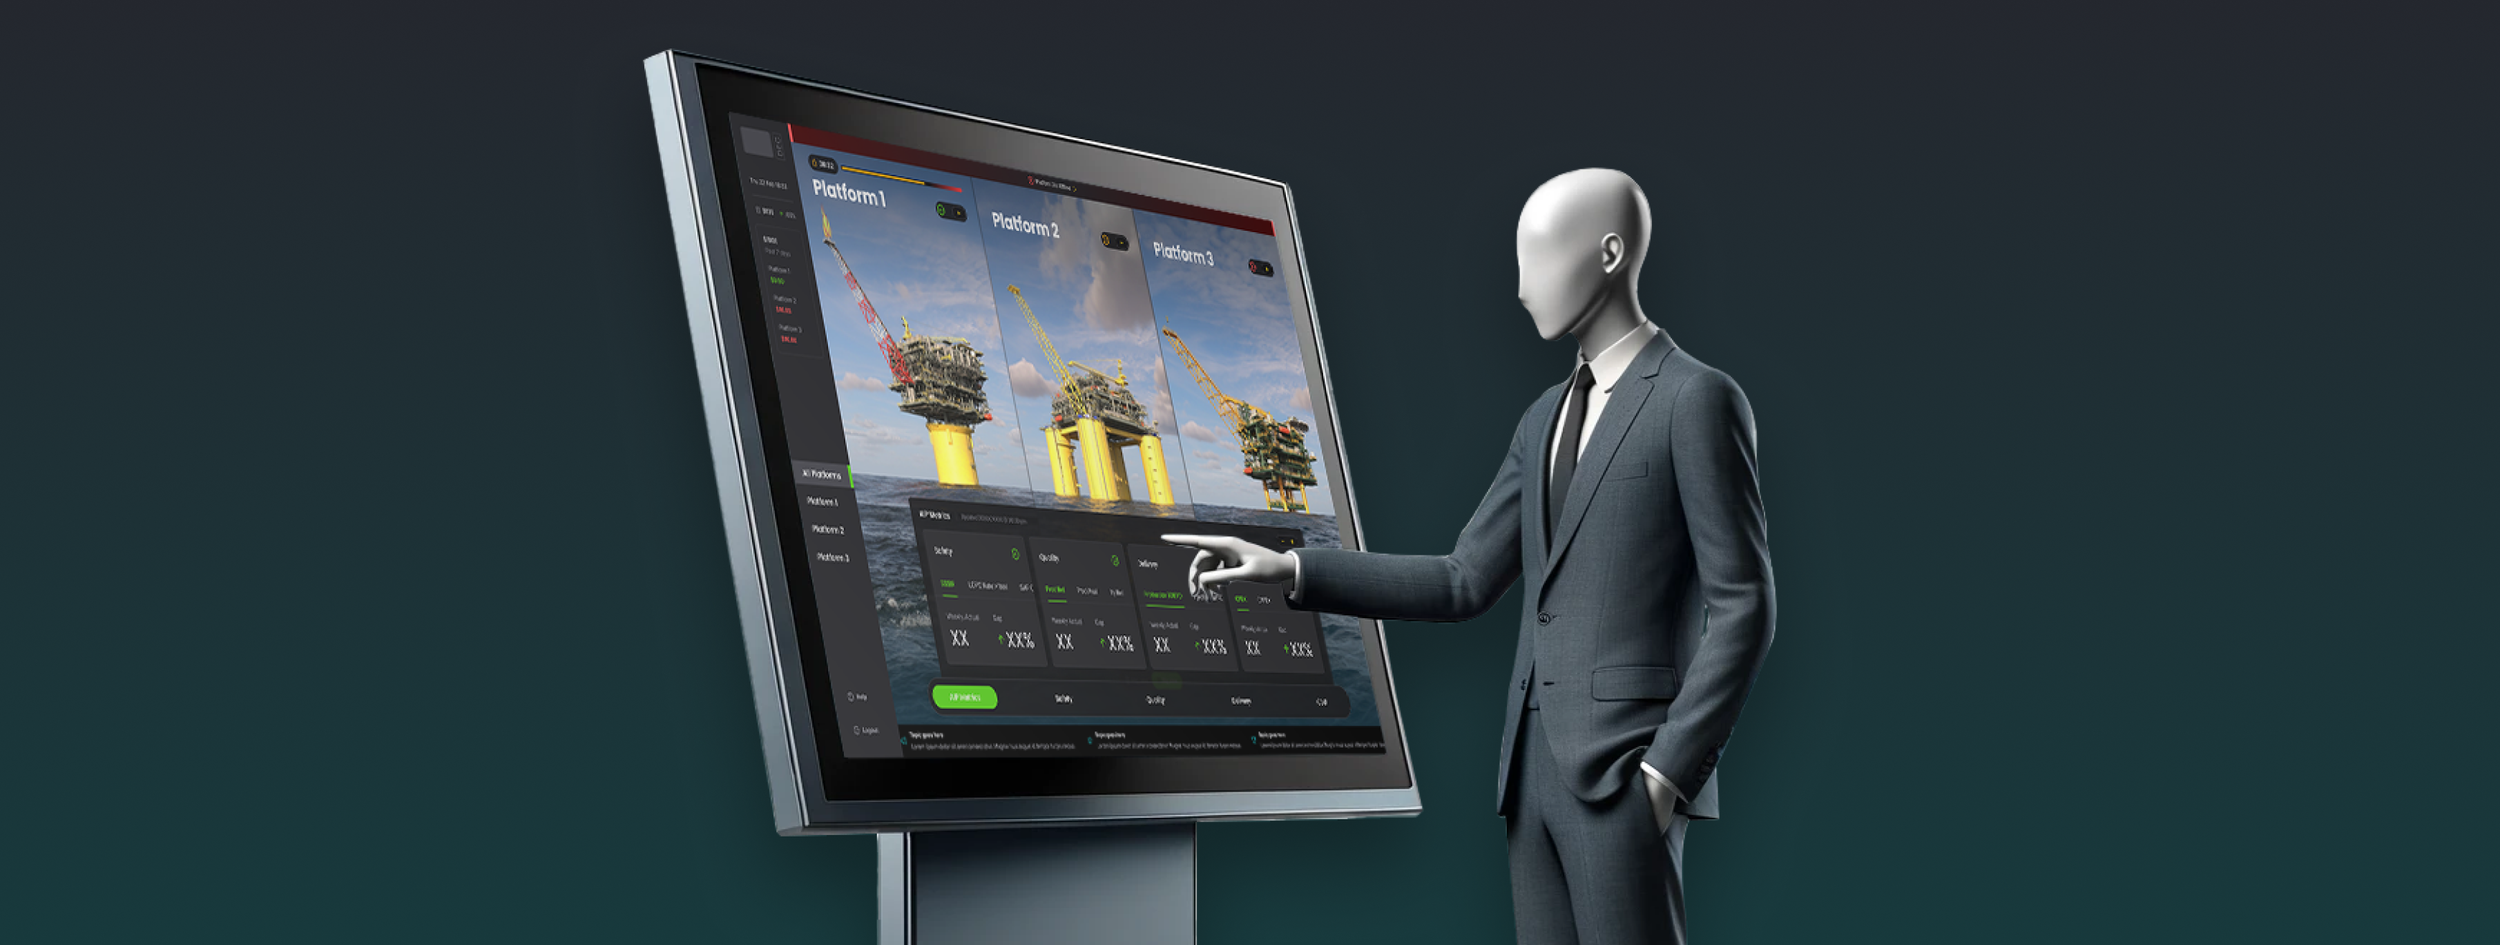
The goal of this project was to discover, visualize, and engineer a new Interactive Real Time Operations Center for a leading oil & gas company — a next-generation digital data visualization center and resource to be located at their operations headquarters.
Solution
The enhanced dashboard and surveillance tools shifted operations from reactive to proactive, enabling early issue resolution and streamlined communication. Real-time monitoring, improved reporting, and proactive asset management boosted efficiency and security.
Process
-
We interviewed stakeholders and subject matter experts (SMEs) to understand user needs and business objectives. With these insights, we created detailed personas that enabled us to design an interactive experience aligned with both user expectations and business goals.
-
We collaborated with data scientists and a 3D visual effects professional to conceptualize and design an intuitive surveillance platform. This interactive tool offered comprehensive visibility into key metrics and operational data for three critical offshore assets.
-
Building on the design phase, we supported development with a robust design system and prototype that evolved into a fully functional dashboard. Continuous collaboration with developers and the 3D designer balanced time, feasibility, and user engagement.
The resulting product provided significant value to our client partners, paving the way for a long-term relationship with the organization.
By the Numbers
20+
Research Participants
16
Remote Interviews
90+
Research Hours
50+
Designed Pages
Persona Development
The development of the personas played a critical role in shaping the platform direction. They served as a strategic foundation for improving user understanding, aligning stakeholders, focusing design decisions, streamlining decision-making, and ultimately creating a more intuitive and effective user experience.


Impact
This project transformed operations from reactive to proactive and delivered business impact that extended far beyond the platform itself. Some of the key outcomes included:
01
Data-Driven Decisions
The enhanced dashboard and production surveillance improvements enabled more informed data-driven decision-making, integrating robust analytics and visualization tools as reliable sources of truth.
02
Stakeholder Management
We streamlined stakeholder management processes, ensuring clear communication and alignment between all parties involved, supported by the insights from the enhanced data-driven approach.
03
From Reactive to Proactive
These tools enabled a shift from reactive to proactive operations, allowing the team to anticipate issues and address them before they escalate.
04
Delegation, Reporting & Forecasting
Improved delegation, reporting, and forecasting processes became possible, enabling more efficient task assignment, comprehensive reporting, and accurate future projections.
05
Keeping an eye on Production
Improved production reporting and surveillance capabilities, allowing for real-time monitoring and more effective management of resources.
06
Asset Vulnerability Monitoring
Identified and mitigated asset vulnerabilities, enhancing operational security and resilience through proactive, data-driven strategies.
Design System

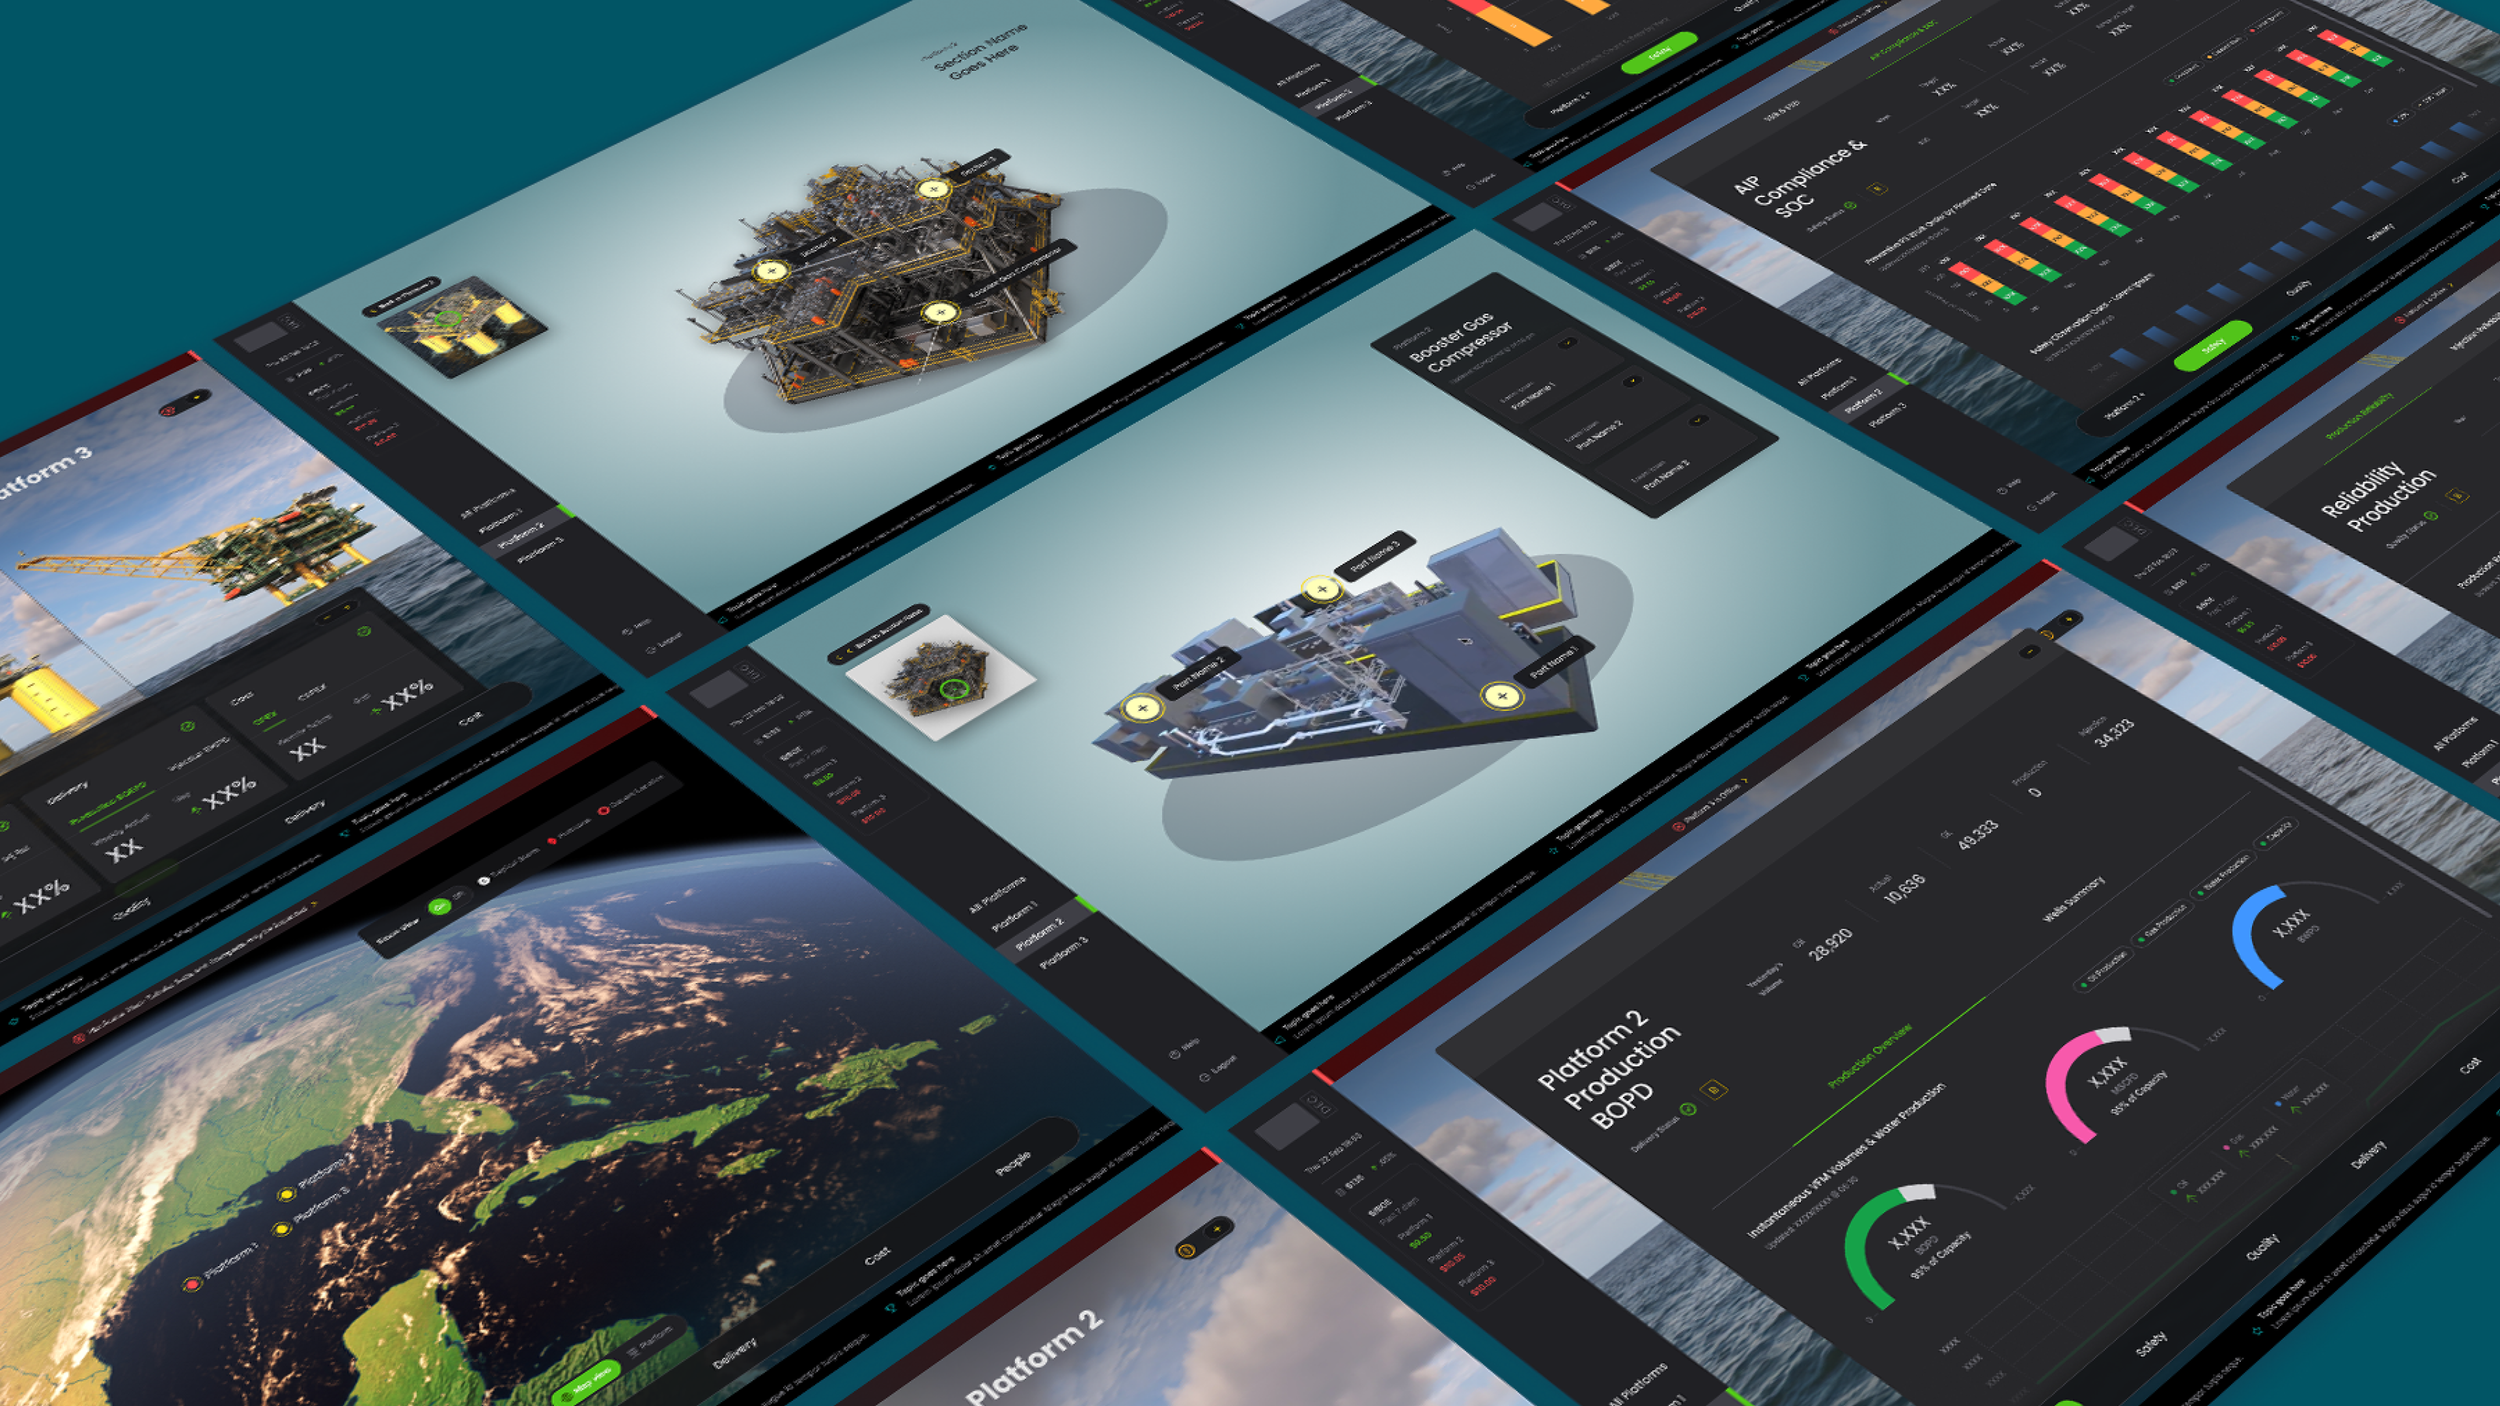
Key Experience Screens
I am very happy with the work you are doing, and respect your work ethic. Good things come to those who do good work.
— Gaute Solaas, Managing Partner, IQumulus